Wyckoff’s Trading Cycle

Wyckoff trading cycle is a great frame work for analyzing and understanding the Market behavior. According to it, there are 4 stages namely- Accumulation, Mark-up, Distribution and Mark-down.

  • Accumulation Phase:
    Begins with institutional investors-such as mutual funds, large banks etc. There is Mass buying of shares of a given stock. Price forms a base as the shares of stock are accumulated at the bottom of a bear market. Market moves sideways in a range and is spread over a long time horizon. One of the Common accumulation pattern- Cup and Handle.
  • Markup Phase:
    When the price breaks out of a range and begins an uptrend, it is called to be a markup phase. This stage is when the price begins moving up. The big money has established a position and retail investors are now invited to join in the profit party. This is the most profitable time to own the stock.
  • Distribution Phase:
    The distribution phase begins as the markup phase ends and price enters another range period. Institutional investors who accumulated at the bottom begin to distribute/ sell before anyone else. This time, the sellers want to maintain higher prices until the shares are sold i.e selling off the shares to the ones entering at a high price. One of the common distribution pattern- Head and Shoulders.
  • Markdown Phase:
    The last phase of the stock cycle is the markdown phase. Markdown begins when the price makes a lower high and no new high. It is when institutions sell inventory, simply taking profit or to change position into another stock or sector. The markdown phase is a downtrend.
  • Naturally, the market doesn’t always follow these phases accurately. Though it’s an interesting framework but has certain limitations:

    1. It is a task to identify the accumulation and distribution phases. Sometimes, what seems to be accumulation turns out to be distribution and vice-versa.

    2. In a similar manner, It becomes difficult to plan a trade as the price moves in a range.

    3. The cycle doesn’t always follow:
    1. Accumulation 2. Mark-up 3. Distribution 4. Mark-down.
    It might go around like 1.Mark-up 2. Distribution 3. Mark-down.
  • In essence, the Wyckoff Method allows investors to make more logical decisions rather than acting out of emotions. But, One shouldn’t just rely on it, rather combine it with other price action strategies.

    Read about the cycle of market emotions- https://www.tradetales.in/the-cycle-of-market-emotions/

    ~For educational purposes only, the charts are used for reference to the content to ease explanation.

TRADING PSYCHOLOGY 101

If you’re new to the field and trying to make sense of it, good.
The charm of seeing numbers flickering on your screen can be exciting and shattering at the same time.

1. The ability to hold these emotions from the beginning will give you an edge.


When you’re just starting, it’s tempting. The thought of conquering it all in a day just gets imprinted on our brains. Because of this, the risk of overdoing pops in.

2. Stick with what works for you and keep adding in along the way.

3. Be self-aware. Know yourself and develop a system that tunes in with your personality and risk appetite.

Let’s say If you can manage many open positions and make adjustments at a quick pace, you might want to give scalping technique’s a shot.

On a similar note, if you feel that this is a hassle for you.
You can try swing trading techniques to lower the pressure and trade with a calm mind. It’s more of a mental game.

4. One aspect that we generally tend to ignore is out lifestyle and priorities.

If you’re in a job due to which you can’t be in front of your screen all the time, you might want to opt for strategies that make it trading possible for you under such constraints swing trading.
Any particular skill set will take time to master. So be responsible for each move you make and even if it goes wrong, try to learn from it.

5. Trading psychology > emotions.

We’re all human beings and the tendency of living in greed and fear sometimes overpowers and clouds our judgements and we make poor decisions.

6. Understand that it’s okay and hold yourself accountable for it.

The trick is to stay focused on what the market is telling you rather than what you’re telling the market to do.

7. Stay disciplined as it goes hand in hand with trading psychology
This enables you to stick to your strategy and risk management rules.

It can be tempting to deviate from your plan when the markets are going haywire but with the right mindset and discipline~ You’ll be able to ace it.

Keep a trade journal to work on your trading psychology.

This is a habit that must be started by traders from the very start.

This allows you to keep track of your profit and loss, trading decisions, trade strategies, and even the factors that influenced your decisions.

To conclude, Developing the right psychology is a long thorough process which includes repetition, review and continual improvement.


OVERCOMING TRADING SETBACKS

Trading is unique profession in the world, where easy money is earned the hard way.

In no other business, you can scale in so fast, and really stand a chance to make 100-1000x.

But uncertainty, risk, emotional upheaval makes this business extremely risky and Probability of success making even 5-10x impossible for most of the beginners.

From execution risk to market risk, there are so many hidden and unaccounted risks lurking in the dark to catch a trader by surprise.

This makes, emotional set-backs very common in the business.
Most of us learn quickly to manage and sail through minor set-backs by following discipline and process.

But What about major ones?

Here are the tools We use to manage them:


  1. Realization that major Drawdown, both expected and unexpected are part of the business, I have written it on my wall.
  2. Having maximum loss limit for the day [We consider 2% of Capital] and max loss limit for month [For us: 10%] makes you avoid days and months which are simply not suitable for your type of trading.
  3. Just like everything in life, set-backs also follow a pattern, so writing a trading journal and finding patterns in these upsetting events, makes me avoid them in future.
  4. Whenever I feel extreme stress, though trigger is not obvious, I get out of my position, can always re-enter, right?
  5. At times. In spite of doing everything right, PNL doesn’t go green and streak of bad luck never ends,
    So reducing position size to half and then half, really helps in not only sailing through the bad phase of DD but also helps manage emotional roller coaster.
  6. Trading is a lonely business, operationally you don’t need anyone. But you need right set of friends to vent out your feelings, your anger when things go wrong and you are not at fault, for instance~ broker ditching you, so cultivating such circle goes a long way.
  7. When we lose money, we get depressed and we don’t want to talk to anyone, even to people who are trying to help, watching our behavior and amending frequently with people helps not only PNL but also prevents burn-out in the long run.
  8. Set-back also gets magnified when we are using leverage, so don’t trade with borrowed capital, even if you have borrowed from your parents.
  9. Nothing teaches as much as a Loss-making streak, so try to learn as much as possible during that phase. Go back to basics, underline the books and finish chapters which were pending for long. Sense of accomplishment will make the flow of right hormones easy for mood recovery. 
  10. Lastly, nothing heals you from a set-back as much as talking to loved ones, even if they are not into the Markets.

PAUSE?

From the Low of 16400 to 18200, We’ve seen Nifty 50 running over 10% in the past few weeks and that too non stop.
But now, As it is trading just 2% away from it’s previous All Time High, Can we expect some correction??

NIFTY 50 DAILY CHART

As we can see in this chart that how Nifty bottomed out at Bullish Harmonic Bat at 16400 and we saw a steep rise towards 18200 which is a potential reversal zone of Bearish Harmonic Cypher, Shark from where We might see an hourly pullback towards 20EMA or 50EMA.

NIFTY 50 DAILY CHART

Though these pattern targets are much deeper: 17600, 17500
But in this momentum where nifty is only 2% percent away from it’s ATH we might not even see a pullback towards the Hourly (20,50EMA)

NIFTY 50 HOURLY CHART

On the other hand USOIL is also trading near Bearish Harmonic Bat zone and the price structure of USOIL and NIFTY is quite similar with minor Lead and Lag effect.

USOIL

In Simple Terms:
Resistance~ 18214, 18396
Support~ 17900, 18050

This article is not a conclusion of where the trend will set in but just our assumption so kindly consult your financial advisor before making any decisions as we’ll not be liable for anybody’s profit and loss.
Interested in Learning Technical analysis or have any queries- Info@tradetales.in

PEACE.

NIFTY REALTY

The sector is picking up strength and has closed above the trendline.

Considering this sector, A few stocks to keep in Watchlist would be:

1. OBEROIREALTY
Holding up very well above Point B.
Harmonic pattern is active and is likely to hit the Potential reversal zone: 998~1020.

2. IBREALEST
Previously, A similar price pattern was seen and after the breakout and gave a good upside of about 40%.

Expecting similar price move above the trendline.

Base formation on the Monthly chart.

3. DLF
Has moved out of the parallel channel and a move above 423.50 will open gates towards previous highs.

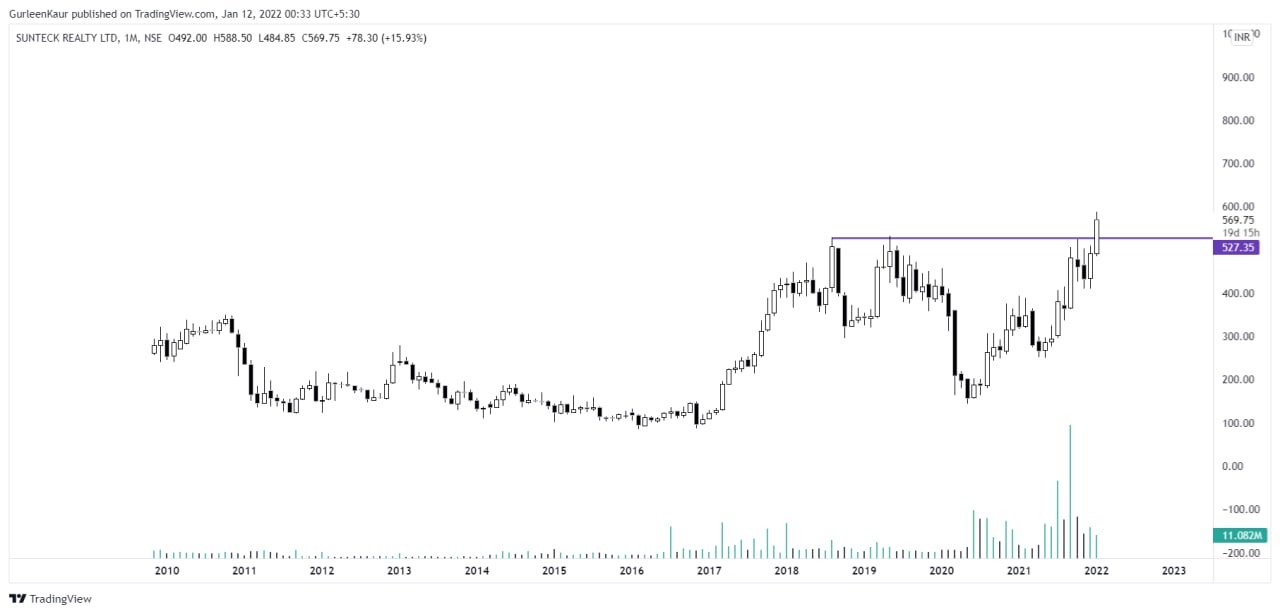
4. SUNTECKREALTY
Multi-year breakout at the level of 527.35

Image

SPX 500

With SPX 500 closing at All Time Highs on 23-Dec-2021 looks like it has consumed the overhead supply from 1.618 Fib Extension the next target here would be 2.618 which is 4976.

SPX 500
1 2 3 7