The NIFTY Smallcap 100 Index is designed to reflect the behavior and performance of the small capitalized segment of the financial market. The NIFTY Smallcap 100 Index comprises of 100 tradable, exchange listed companies.
View- Bullish Let’s look at the thorough technical analysis of Nifty SMLCAP 100 grab your cup of coffee.
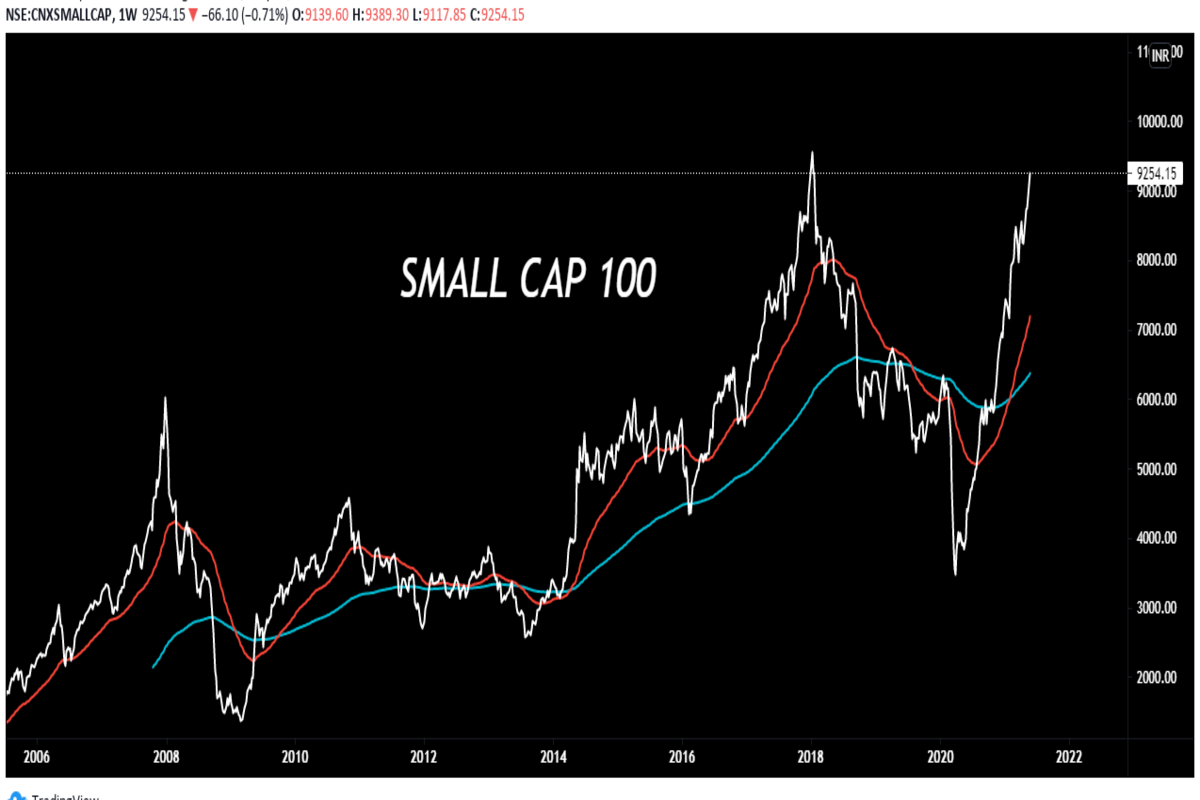
CNXSMALLCAP100 Weekly time frame indicates that a golden crossover was panned out in the month of January later this year. As you can see when that happened earlier on 24th march 2014 it topped out in 2018 and we witnessed a sharp bull phase upside for 4 years (Round figure). Well, looking at the current scenario this crossover panned out in January and we are now expecting at least 2 to 3 years of bull phase in small cap space.
Also it is very near to it’s top once that happens bulls will have an open arena to crush the bears.
Monthly chart shows that after 1st April,2020 prices did not close below the previous month for even once which shows a very strong trend.
Taking two swings from 2008 top and 2009 bottom previous bull phase ended by completing it’s 1.618 retracement and we saw a long term top.
Now here if we manage to cross the Top Target is going to be 1.618 retracement which is 13644 just like before taking the two swings of 2018 high and 2020 bottom this target is estimated. If this setup plays out well position yourself accordingly and enjoy the next Bull phase which might last several Years.
Disclaimer- The analysis are only for educational purposes. Trade tales is not liable for your Profit or loss. Kindly refer to your financial advisor before taking any decisions. PEACE
A Golden crossover is a Technical way of forecasting the market using moving averages. Some traders and investors often combine it with other indicators and methods so that their risk reward ratio is favorable.
Most of the techniques in technical analysis can be used from 1min time frame to a monthly time frame horizon. There are no specific tools which are only to be used in monthly or weekly timeframe’s. It’s about ‘how you want to use it according to your own trading and investing style?’ Getting straight to the point; Golden crossover happens when, short to medium term 50DMA crosses the long term 200DMA. DMA- Displayed moving average.
Almost all the charting platforms provide this tool for free and you just have to plot these averages and look for 50DMA crossing 200DMA from below. Majorly after a golden crossover in higher timeframe like weekly and monthly we can expect at least 2-3 years of bull market or more depending on other economical factors.
This is one of the best method’s to forecast the market phases and take positions accordingly. The rationale is also very simple: Let’s understand it with the help of example here- When price crosses 50DMA, It simply means that the last 50 day average price is crossed which was earlier acting as a resistance and now we can expect the next phase to be bullish or sideways with bullish bias.
In the same way when 50DMA crosses 200DMA, It means that the last 50 days average price has crossed above 200DMA and price is also above both of these averages. We take it this way that the supply of over 50 and 200 days is now being cleared and a strong rally upside is due.
In the above chart red cord is 50DMA and blue cord is 200DMA and it’s quite clear what happened after the crossover.
We’ve explained this chart completely combining the other methods of estimating the next move because that’s where money is made. Isn’t it? Link- https://www.tradetales.in/nifty-smlcap-100/
Do tell us in the comment box where you saw a golden crossover happening and how you traded it?
Disclaimer- This blog is for educational purposes only. Kindly refer to your financial advisor before taking decisions. PEACE.
Nifty closed at All time high 15435 this Friday after the monthly expiry. Now what next can we expect from the index as it is coming out from nearly 2 months of not clear trend one side but after closing above previous all time highs the sentiment is again bullish. Well, we are overall bullish on NIFTY but expecting a minor pullback ticket to the next bull phase because a Harmonic Bearish Alt shark was spotted on the index.
As this chart shows that the reversal zone for nifty is 15475 and if we pullback from here the next buying zone is at 14960 which is a very strong support according to technical analysis but if somehow bulls manage to close above 15475 (+- 10 points). This level will act as a very strong support.
Getting to the overall sentiment which looks quite bullish right now and assuming that we close above our reversal area what next might happen??
As you can see in the above chart NIFTY made a similar pattern in October series and after one month of accumulation there was a very strong rally which paused at the end of February 2021 but now the sentiment is again bullish and with fall in coronavirus cases bulls look again ready to hit all the walls of worry. Descending Trendline breakout here followed by a very healthy pullback is cherry on cake.
Also keeping in mind the Fib resistance 1.618 which was at 15413 from where the market got rejected last time and made a short term top is now breached and we are expecting a very strong rally ahead but with shakeouts to flush out the retailers.
All in all; the structure is quite bullish and we are expecting a minor pullback which might offer us a ticket towards next phase of bull market with high reward and low risk.
All these views and charts were shared on our telegram channel and twitter handles well in advance and this move was anticipated by us which gave quite good returns looking at the risk and reward ratio.
Disclaimer- This post is only for educational services, we are not liable for your profit and loss. Kindly consult your financial advisor before taking any decisions.
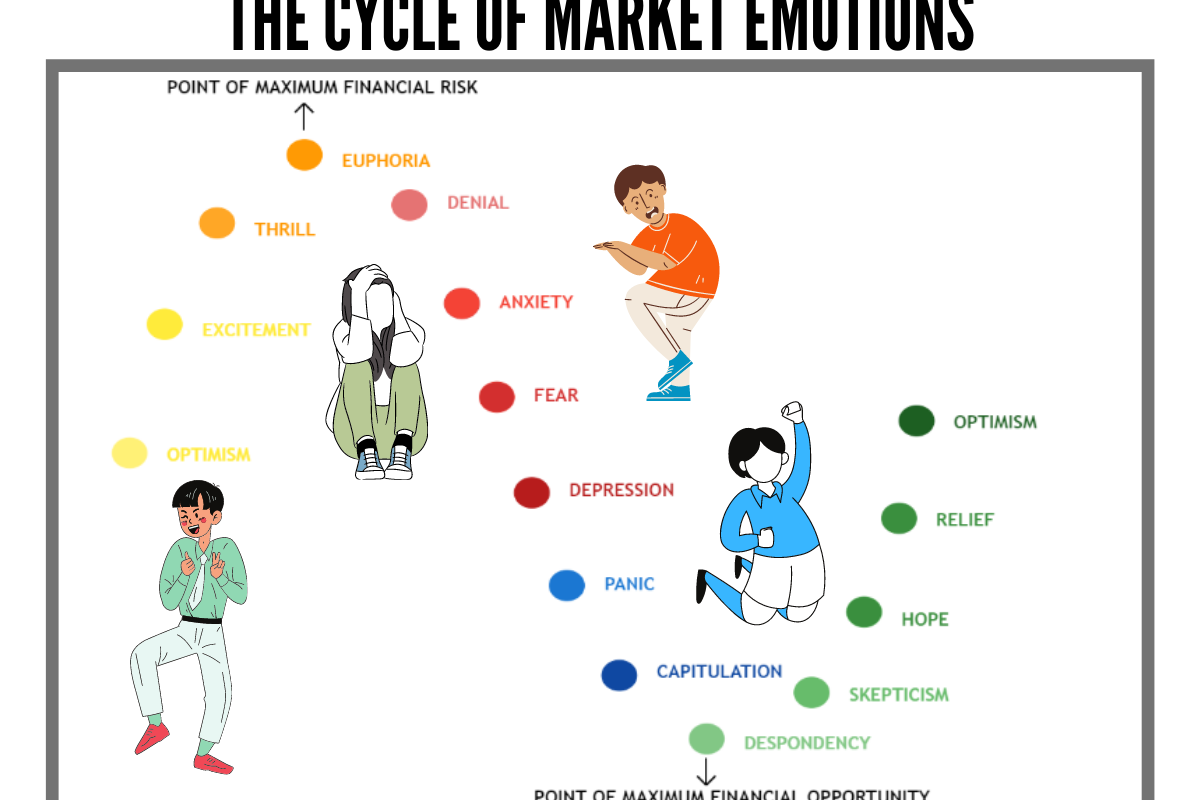
“Control your emotions or be consumed by them.” This is exactly how the financial markets play. You need to be cautious enough to surf the wave of emotions described below:-
Optimism: It is the hopefulness and confidence about the future or the success of something. We step in the markets and have the hope and confidence of succeeding against all odds.
Excitement: Excitement drives in when the market moves in the direction we hoped. Excitement also brings motivation for future endeavors.
Thrill: When the momentum carries on, the gains that we’ve made give us thrill and we further expect higher returns.
Euphoria: As the cycle tops, there comes the state of utmost satisfaction where we start to believe that we made smart moves and the same will continue without realizing the uncertain nature of the markets. We tend to fool ourselves by now playing beyond our appetite. At this point, the financial risk is at it maximum, like the possible financial gain.
Denial: When the market turns, we watch intently for a favorable move so as to save ourselves from being a victim of loss.
Anxiety: As the market continues to plunge, anxiety sets in. We see our investment values declining and this is the first time that you experience the market going against you. You now hold onto the investment as you don’t want to book losses and here in, you see yourself as a long term investor.
Fear: When the losses accelerate, fear kicks in. At this point, we might even pick riskier choices to recover our losses.
Depression: The reality of the bear market makes us depressed and question our conscience about the moves we made. We become desperate to overcome it.
Panic: Having no idea of what to do next and thinking that we had a chance to book our profits makes us panic-stricken and at this point, we might make unusual decisions that may cause further damage.
Capitulation: Understanding that the market isn’t predictable, we feel helpless and dump our investments.
Despondency: Having booked losses, We now reflect the choices we made and wonder whether we should have invested in the first place? We now have low spirit and confidence and this is the point when we miss out great financial opportunities. Hence, It is the point of Maximum financial opportunity.
Skepticism: As the market starts making higher lows and higher highs, We’re in doubt and stay cautious to outlook if the trend will last.
Hope: The uptrend remains intact, we might feel reluctant to re-invest but looking at the attractive scope, We hope to make gains.
Relief: The market now seems to be recovering. For the ones who let their emotions take control, the cycle might again begin.
An illustration as to how quickly our emotions change with respect to the market movement has been explained below with the help of NIFTY’s weekly chart. Now that you’re well versed with the emotional cycle, What emotional stage are you on? Drop down your answers in the comments.
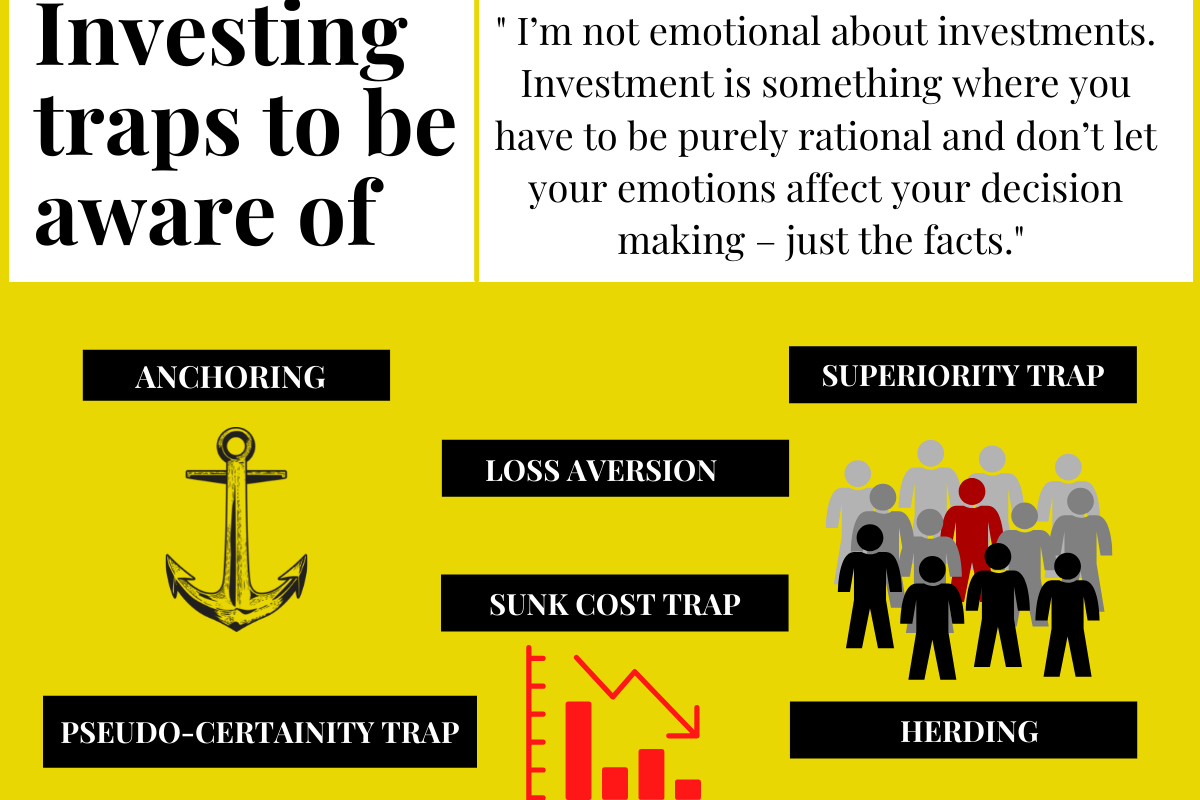
We get bound by our emotions and the investment traps. We seek instantaneous profits and follow along with everyone which in turn alters our thought process. Buying low and selling high is still one of the best strategies to build wealth and become a successful investor over the years. Being aware is the key to acing it.
Human psyche is incredible yet dangerous as we fall victim to it. It is very easy to cling to mistakes over and over again in the pursuit of a changed result. In the heat of the moment, we get confused and fall into the traps that we should be avoiding. In investing, wrong perception, delusions can cost you handsomely. So Beware!
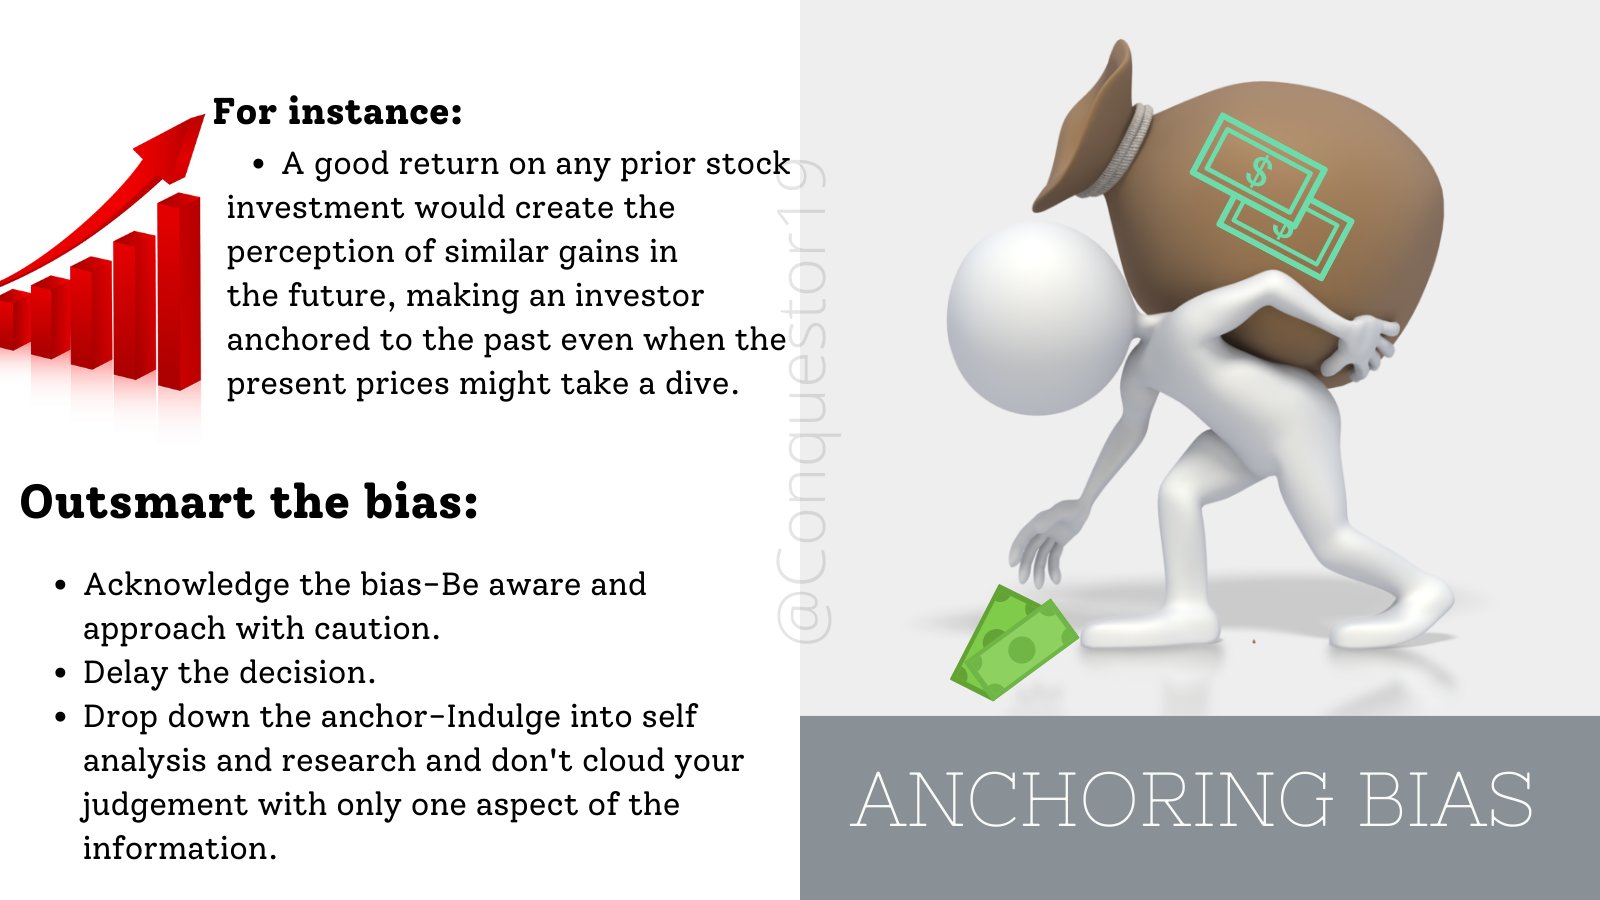
Trap 1:- Anchoring:
Describes the tendency to only rely on top piece of information and getting anchored to it while decision-making. It causes a lot of oscillation and hinders the decision-making ability.
For instance, you had a good return on a stock in the past, your perception on the future returns would be similar, even when the prices might take a dive.
Escape the trap:
Acknowledge the bias
Delay the decision
Drop down the anchor
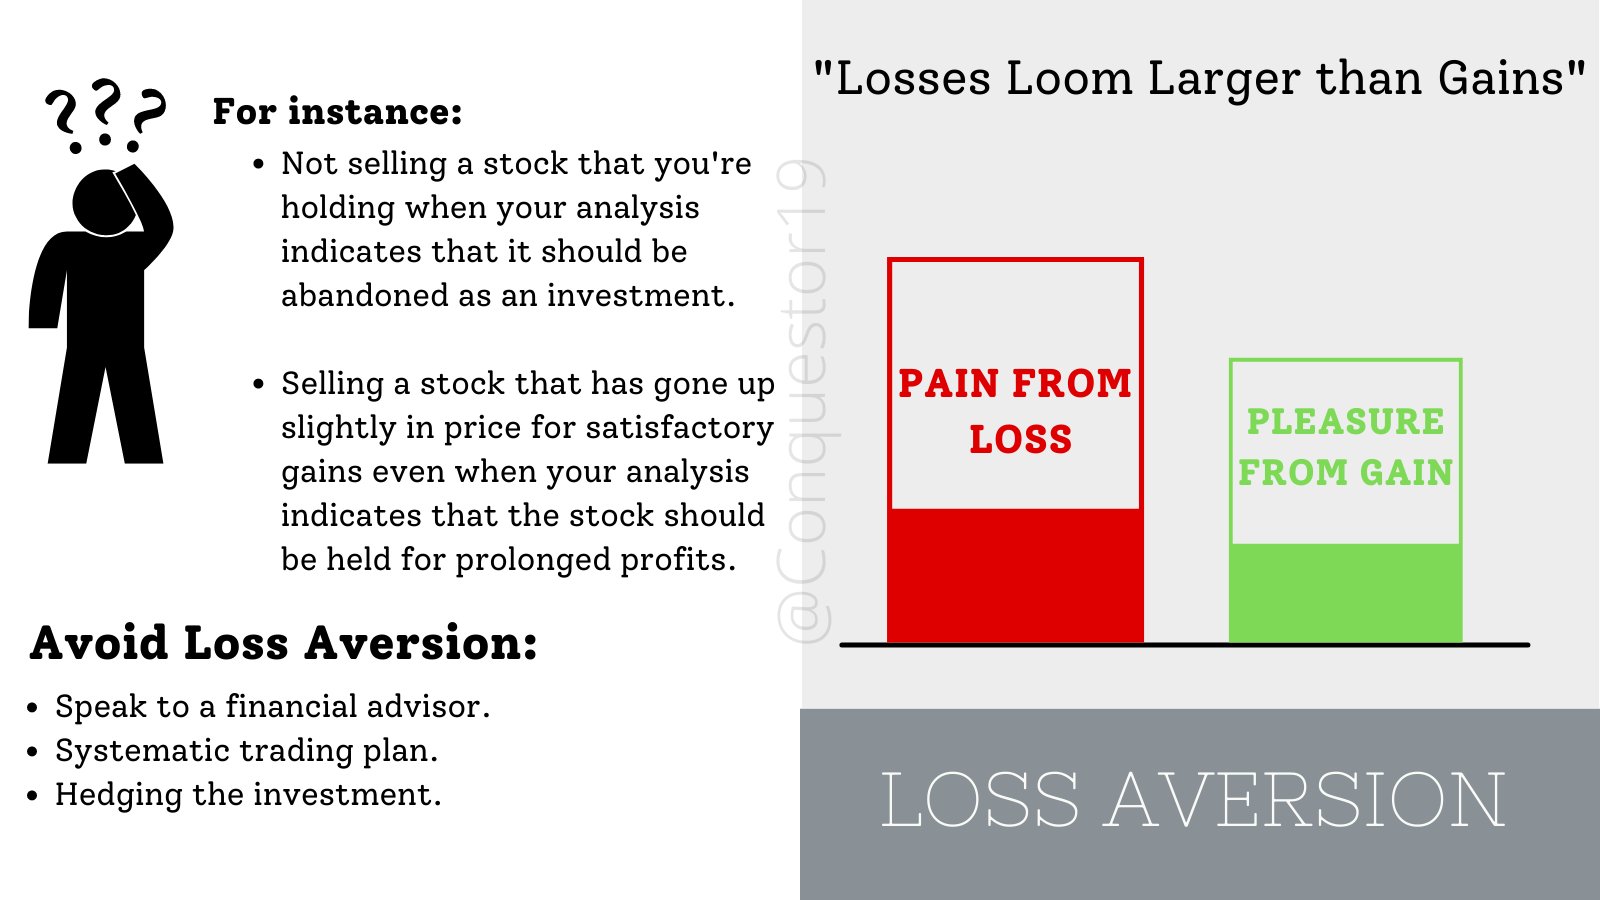
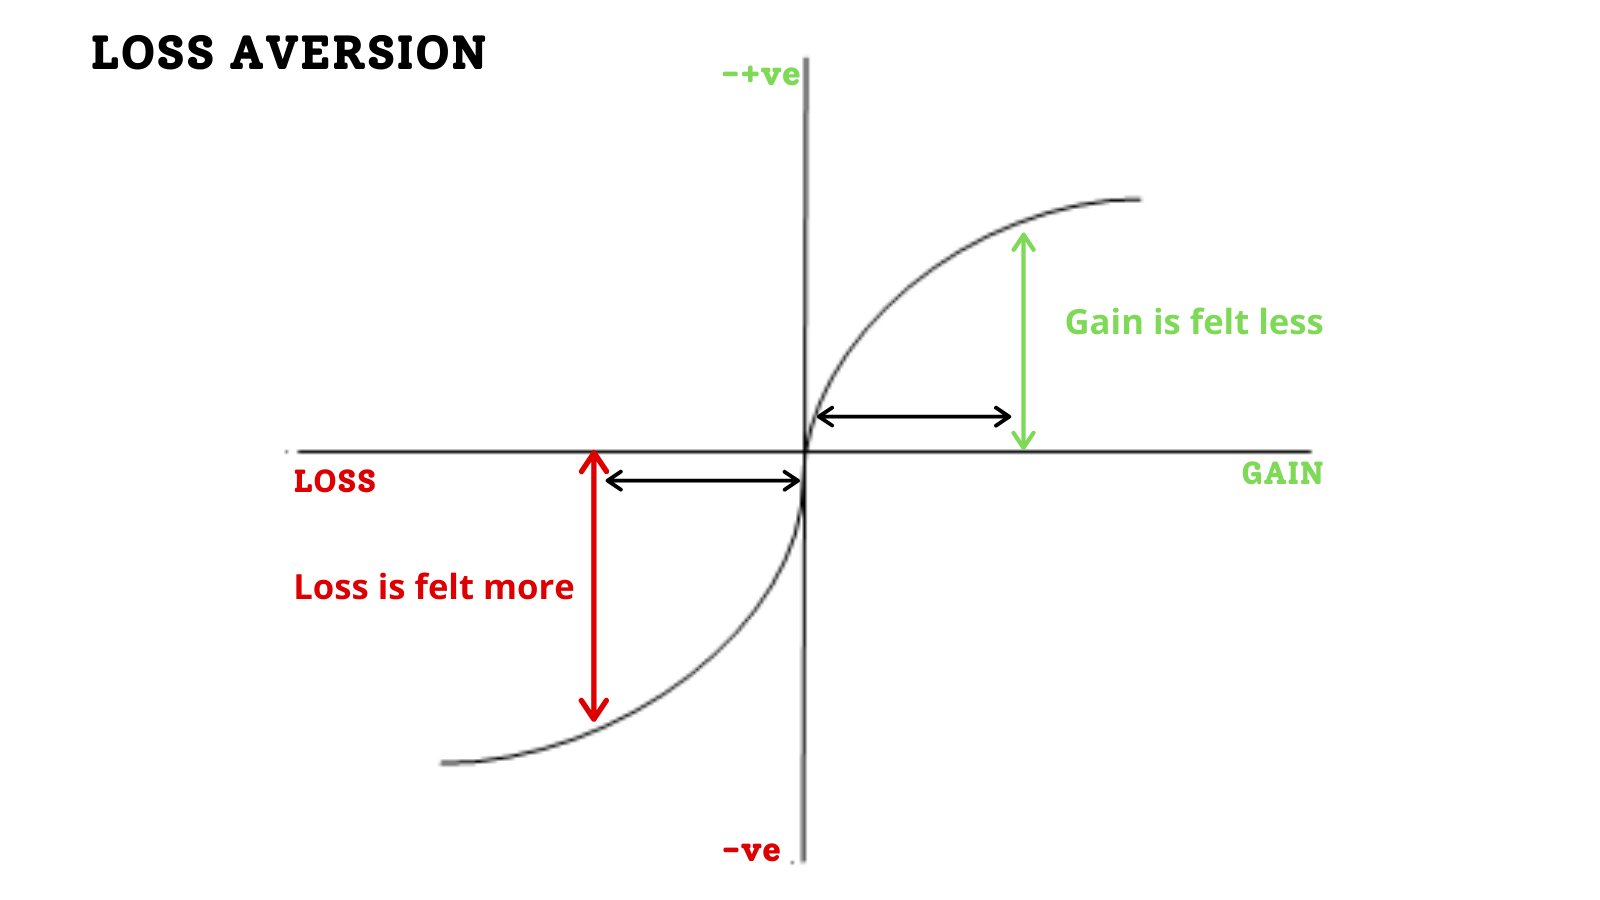
Trap 2:- Loss Aversion
Is the tendency of going to extreme lengths to prevent losses. Suppose we buy a stock for ₹100, and then it falls by10%. We are sitting on a loss. Human psychology doesn’t like encountering a loss-so we hold onto the stock hoping to make a profit on our decision. However, if there is bad news about the stock. it is more sensible to sell and minimize our losses.
Avoid Loss Aversion:
Speak to a financial advisor
Systematic trading plan
Hedging the investment.
Trap 3:- Herding:
In simple words, Consider there is a riot and despite of it being worthy or not; people pledge to join it and follow without their own research. That’s exactly what herding is.
Herd instinct occurs when investors begin following the crowd instead of their own analysis. It is said to create bubbles or crashes in the financial markets due to panic buying or panic selling. Following the crowd can cause amplification of fundamentals.
Let’s say the price of stock ABC started escalating quickly and went beyond the intrinsic value. Because everyone is panic buying, you also decide to hop in but at a higher price. At this moment, Investors are not willing to buy and the stock collapses.
Avoid Herding:
Make investments based on sound strategies.
Don’t fall prey of escalating prices.
Do your research.
Trap 4:- Superiority Trap:
The moment ‘confidence’ changes into ‘over-confidence’, Nothing remains. A lot if investors like to think that they’re better than others and this thinking precedes the reality and they’ve ended up losing fortunes. Feeling that you know more than others or than you actually do is a crucial mistake.
Someone with a Ph.D in finance may end up delivering the wrong perspective being clouded with superiority but on the flip side, A high-school graduate might have an amazing way with the markets.
Avoid Superiority trap:
Learn from the mistakes of others. You can’t live long enough to make them all yourself.
Trap 5:- Pseudo-Certainty Trap:
When most people start to see their portfolios turn red, they often act out of desperation. They pile on risk to try and win it all back. This is a huge mistake. Most likely, it won’t pay off. Rather you’re risking it all. Just as you can’t catch a falling knife. Projecting the fall and trying to cover up your loss, you might end up losing more.
Avoid Pseudo-Certainty trap
1. As mentioned in the chart below, Ride the trend and avoid when It’s against.
Trap 6:- Sunk Cost Trap
We’ve all been victims of the sunk cost trap at some point of time.
Ever sat in the movie theatre and realised that you’re not enjoying it but you refuse to walk away because you’ve paid for it. Ever kept clothes in your closet that don’t fit you anymore and refuse to give them away simply because you put in a great deal of money into them.
Similarly, The sunk cost trap occurs when we’re holding onto a bad investment and refusing to sell it off. We see the stock plunging but try to average it out in the hope that the prices will eventually go higher.
Avoid Sunk Cost Trap :
Set investment goals.
Have a strict Stop-loss.
The bottom line is- It’s easier said than done. Human emotions can be very challenging but you’ve to take control of them or else you’ll end up falling prey of one of these traps and losing your hard earned money. Be aware and realistic about the investments you make.
I’m not emotional about investments. Investment is something where you have to be purely rational and don’t let your emotions affect your decision making – just the facts.”