PAUSE?

From the Low of 16400 to 18200, We’ve seen Nifty 50 running over 10% in the past few weeks and that too non stop.
But now, As it is trading just 2% away from it’s previous All Time High, Can we expect some correction??

NIFTY 50 DAILY CHART

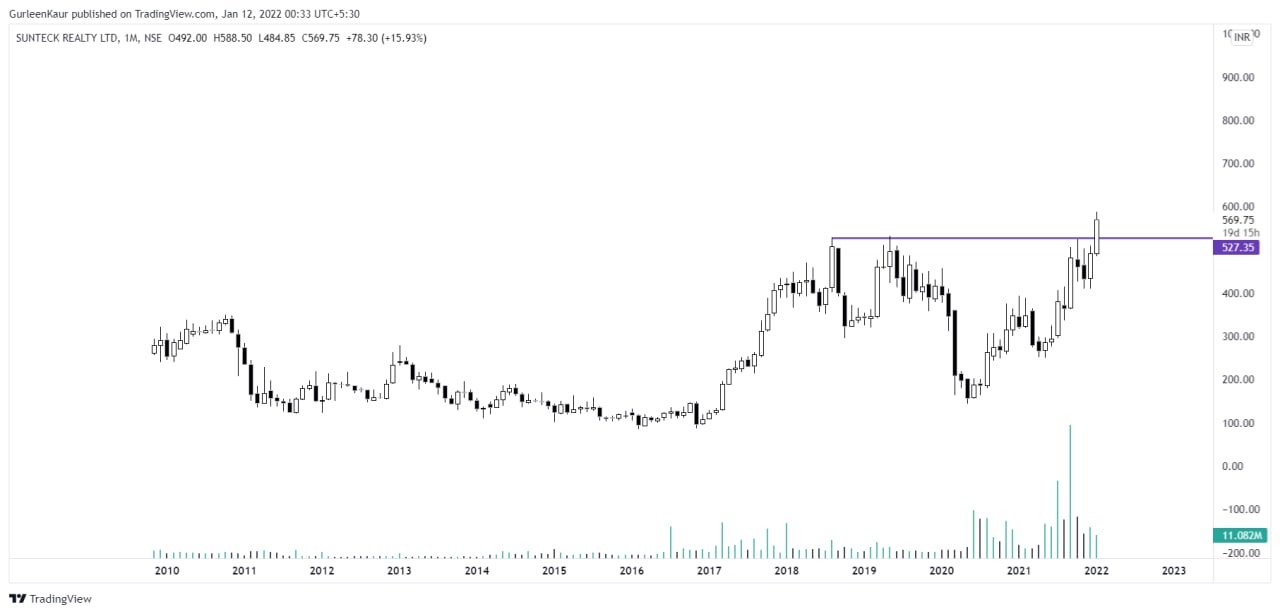
As we can see in this chart that how Nifty bottomed out at Bullish Harmonic Bat at 16400 and we saw a steep rise towards 18200 which is a potential reversal zone of Bearish Harmonic Cypher, Shark from where We might see an hourly pullback towards 20EMA or 50EMA.

NIFTY 50 DAILY CHART

Though these pattern targets are much deeper: 17600, 17500
But in this momentum where nifty is only 2% percent away from it’s ATH we might not even see a pullback towards the Hourly (20,50EMA)

NIFTY 50 HOURLY CHART

On the other hand USOIL is also trading near Bearish Harmonic Bat zone and the price structure of USOIL and NIFTY is quite similar with minor Lead and Lag effect.

USOIL

In Simple Terms:
Resistance~ 18214, 18396
Support~ 17900, 18050

This article is not a conclusion of where the trend will set in but just our assumption so kindly consult your financial advisor before making any decisions as we’ll not be liable for anybody’s profit and loss.
Interested in Learning Technical analysis or have any queries- Info@tradetales.in

PEACE.

NIFTY REALTY

The sector is picking up strength and has closed above the trendline.

Considering this sector, A few stocks to keep in Watchlist would be:

1. OBEROIREALTY
Holding up very well above Point B.
Harmonic pattern is active and is likely to hit the Potential reversal zone: 998~1020.

2. IBREALEST
Previously, A similar price pattern was seen and after the breakout and gave a good upside of about 40%.

Expecting similar price move above the trendline.

Base formation on the Monthly chart.

3. DLF
Has moved out of the parallel channel and a move above 423.50 will open gates towards previous highs.

4. SUNTECKREALTY
Multi-year breakout at the level of 527.35

Image

SPX 500

With SPX 500 closing at All Time Highs on 23-Dec-2021 looks like it has consumed the overhead supply from 1.618 Fib Extension the next target here would be 2.618 which is 4976.

SPX 500

Banknifty ready to take down previous ATH?

After facing some heat from the larger Timeframe Trendline resistance Banknifty consolidated for almost 5-6 months if we look at a larger timeframe but in AUGUST it has closed nicely above 35600 which was acting as a resistance.

BANKNIFTY MONTHLY LOG SCALE

As of now chart of Banknifty indicates good accumulation just below the trendline resistance and if it takes out this resistance we can expect Banknifty to reach our previous target which is 42000.
Link- https://www.tradetales.in/banknifty-42000/

BANKNIFTY DAILY

A daily close above 36870 and we are heading towards 42222.
#HarmonicBat

For queries you can mail us here at- Info@tradetales.in

Disclaimer- This post is for educational purposes only kindly consult your financial advisor before taking any decisions we’re not liable for anyone’s profit and loss.
PEACE.