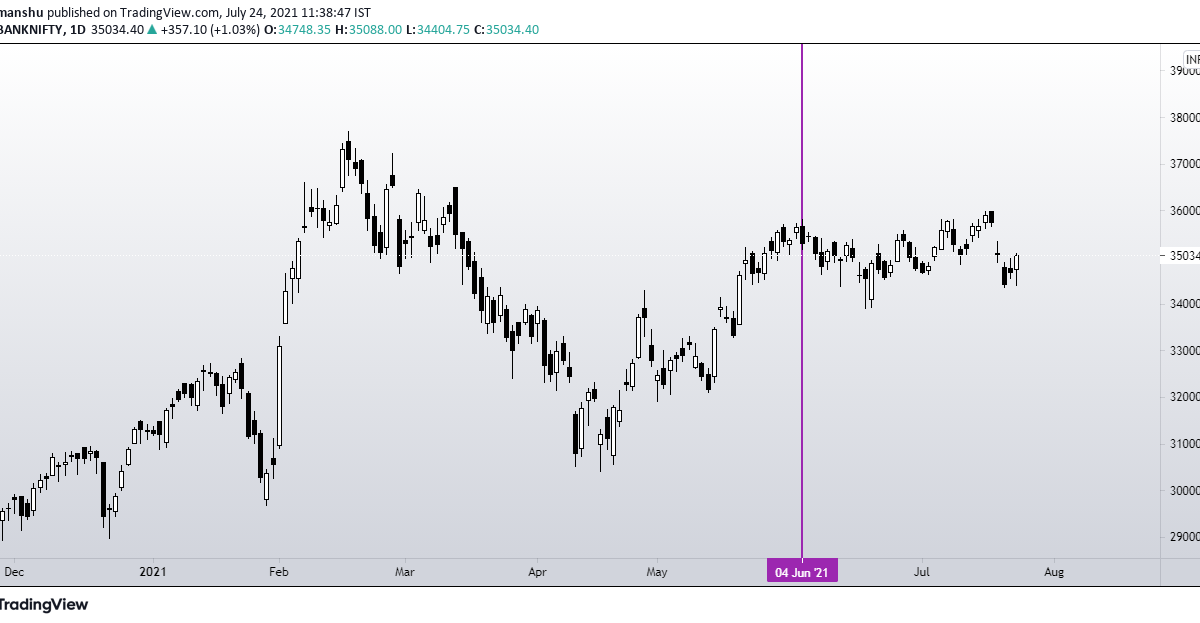
After 4th of June, the trend for Banknifty is not quite clear whether to Buy the Dip or Sell on rise as one day it moves smoothly and the very next day it gets volatile, Kind of non directional within a range considering the previous month’s data.

This is the daily chart of Banknifty where the 1st Bullish Bat pattern played very nicely on both long as well as short side. Now we’ve another valid Bearish Bat pattern which will stay valid above point B which is [34287] and target for this pattern is the red PRZ zone. [Potential reversal zone].

Banknifty has not only managed to close above B point but also 0.618 retracement [Swing High to Swing Low] which opens the gates for our Target- 36800.
Banknifty OI data shows that there is not much difference between CE and PE writers at 35000 strike at the moment but we’ve 4 trading sessions left and this data keeps on changing.

Bearish view-


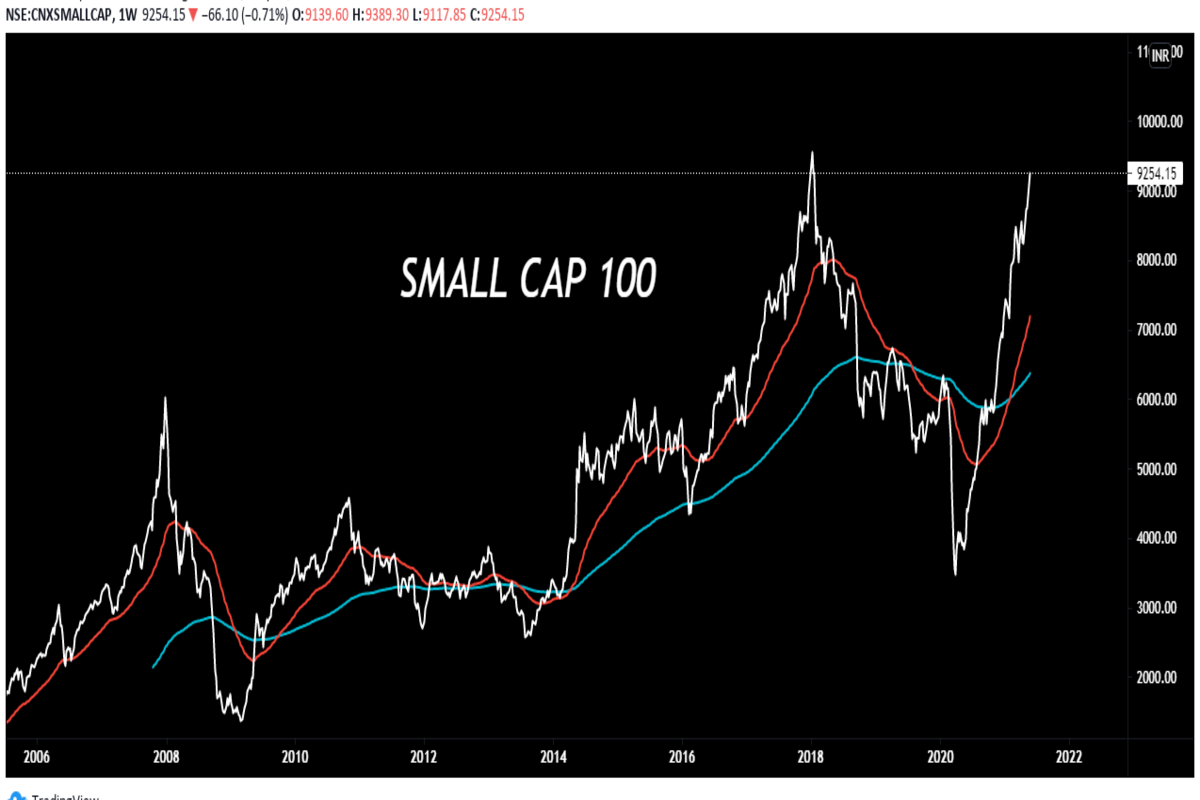
In a larger timeframe it is just consolidating near a very strong resistance of more than 10 years and we’ve observed that whenever the consolidation happens near ATH the next breakout or breakdown move is quite trendy.

Our Target for Banknifty remains the same 42222- https://www.tradetales.in/banknifty-42000/
Disclaimer- This post is written only for educational purposes. Kindly consult your financial advisor before making any decisions.
PEACE.