Post breakout at 18 month’s long resistance, Now In Monthly TF; NESTLEIND is heading for a retracement towards the breakout level which gives it a bullish indicative after it takes support at those levels.
Major Fibonacci support levels: 17803.95 ~ 18339.60
In the Weekly TF; A series of price movements can be observed that graphically form the shape of a “U”.
Also It can be observed that; The down ward move started at the Potential Reversal Zone of Harmonic pattern. Now that the short side target’s will soon be hit. It shall take a bounce from those levels.
The overall setup looks quite interesting and bullish.
For queries related to this post or Technical Analysis you can mail us here at-Info@tradetales.in
Disclaimer~ This post is shared for educational purposes only kindly consult your financial advisor before taking any decisions we’re not liable for anyone’s profit and loss.
HDFC Life Insurance after breaking out 646 it’s pre Covid-19 High has sustained very nicely above the breakout level and we can see a nice narrow range price squeeze on the technical chart with follow up attempting a minor breakout soon. #Bullish
HDFC LIFE INSURANCE MONHTLY LOG SCALE
On the Weekly timeframe we can see an Inverse Head and Shoulder Pattern Breakout and the price has sustained above the breakout level very nicely if we try to estimate the technical target for this script so it is 950+
Weekly chartSource- STATISTA
For queries related to this post or technical analysis you can mail us here at- Info@tradetales.in
Disclaimer- This post is shared for educational purposes only kindly consult your financial advisor before taking any decisions we’re not liable for anyone’s profit and loss. PEACE.
In this blogpost we will be sharing our analysis on top 4 stocks in the alcohol sector sorted market cap wise:-
1. UNITED SPIRITS
As it is quite visible that the stock has already broke out from the descending trendline resistance and bulls are itching to reclaim the ATH once again. September monthly closing is going to play a very important role here and if the stock reclaims it’s ATH once again we might see some selling pressure as it’ll be breaking out after 5 years as the impatient investors who invested around this zone will be selling their stake aggressively. (Just a theory)
UNITED SPIRITS MONTHLY LOG SCALEUNITED SPIRITS MONTHLY LOG SCALE
A parallel channel pattern is also visible on the charts with good base formation in United spirits.
2. UBL
Attached below is the chart of UBL which was trading inside a parallel channel since 8 years and the stock has reclaimed it’s ATH recently. Though, the channel top is quite near which might give an opportunity to add this script on dips.
UBL MONTHLY LOG SCALE
3. GLOBUS SPIRITS
We’ve added Globus spirits in our portfolio when it crossed 422 in June series 2021 and by looking at the price structure it indicates that we are in the 3rd wave and there are no signs of reversal as of now. So one can keep this script on their watchlist as well to add on dips.
GLOBUS SPIRITS MONTHLY LOG SCALE
4. RADICO KHAITAN
In a larger timeframe; the coronavirus hit on this stock looks like a pullback and since then the price is not ready to give up. Another fine script from this space which is getting accumulated in every dip.
RADICO KHAITAN MONTHLY LOG SCALE
Radico khaitan is forming a very nice flag/rectangle pattern (Accumulation) right at the top and by the price volume action, it looks like selling is getting absorbed and we can see a decent move on the upside sooner or later (Just an estimate).
For queries related to this post or technical analysis you can mail us here at- Info@tradetales.in
Disclaimer- This post is shared for educational purposes only kindly consult your financial advisor before taking any decisions we’re not liable for anyone’s profit and loss. PEACE.
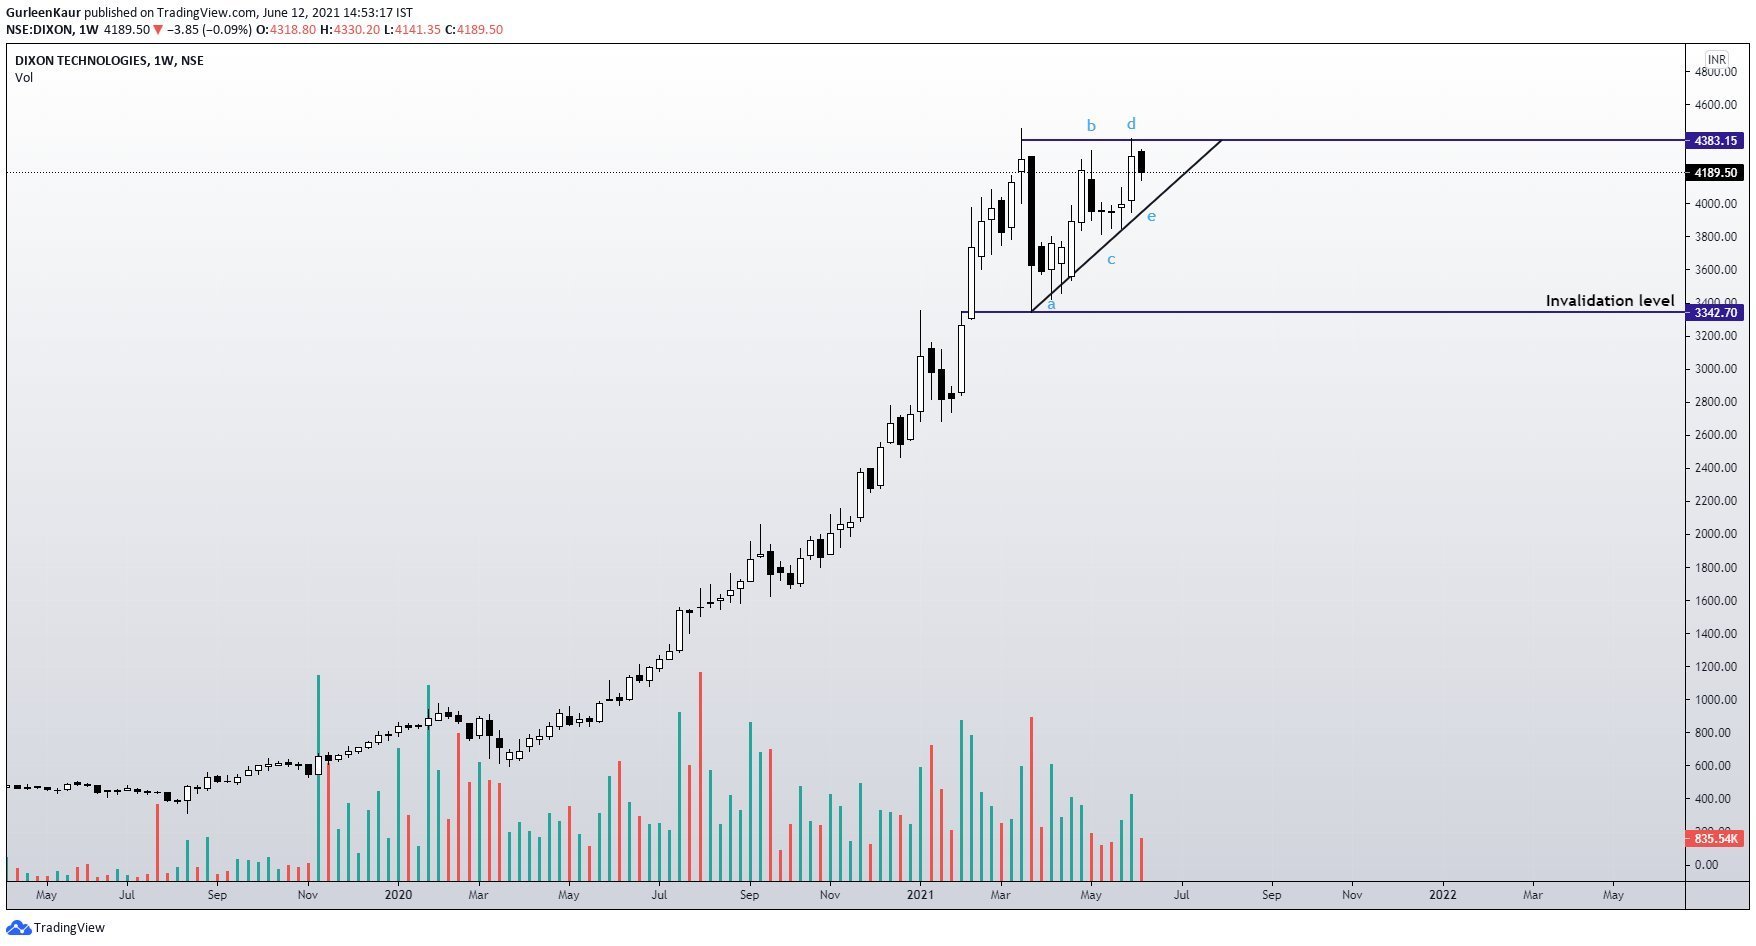
As on June 12, 2021; Dixon was observed to be running along higher lows and constructing an ascending triangle on weekly basis.
On June 18, 2021; It gave a clean weekly breakout along with average volume and closed above the horizontal resistance of 4383, The closing price was 4427.15 . It is now in the uncharted territory. Sustenance above 4383 and a breakout above fib 0.618 extension level (4441.35) would trigger 4500+.
Disclaimer- For educational purposes only, Views are not an advice.
Kindly consult your financial advisor before taking any decision.
Berger paint looks good technically after giving a breakout from Bullish pennant and chart shows good price compression below the supply zone. Now why I’m bullish here is because the Trend is overall bullish and in this scenario mostly i’ve observed that breakouts happen on the upside and accumulating before the breakout gives good Risk to reward ratio.
This post is only shared for educational purposes. Kindly refer to your financial advisor before making any decision. PEACE.