HDFC Life Insurance after breaking out 646 it’s pre Covid-19 High has sustained very nicely above the breakout level and we can see a nice narrow range price squeeze on the technical chart with follow up attempting a minor breakout soon. #Bullish
HDFC LIFE INSURANCE MONHTLY LOG SCALE
On the Weekly timeframe we can see an Inverse Head and Shoulder Pattern Breakout and the price has sustained above the breakout level very nicely if we try to estimate the technical target for this script so it is 950+
Weekly chartSource- STATISTA
For queries related to this post or technical analysis you can mail us here at- Info@tradetales.in
Disclaimer- This post is shared for educational purposes only kindly consult your financial advisor before taking any decisions we’re not liable for anyone’s profit and loss. PEACE.
After facing some heat from the larger Timeframe Trendline resistance Banknifty consolidated for almost 5-6 months if we look at a larger timeframe but in AUGUST it has closed nicely above 35600 which was acting as a resistance.
BANKNIFTY MONTHLY LOG SCALE
As of now chart of Banknifty indicates good accumulation just below the trendline resistance and if it takes out this resistance we can expect Banknifty to reach our previous target which is 42000. Link- https://www.tradetales.in/banknifty-42000/
BANKNIFTY DAILY
A daily close above 36870 and we are heading towards 42222. #HarmonicBat
For queries you can mail us here at- Info@tradetales.in
Disclaimer- This post is for educational purposes only kindly consult your financial advisor before taking any decisions we’re not liable for anyone’s profit and loss. PEACE.
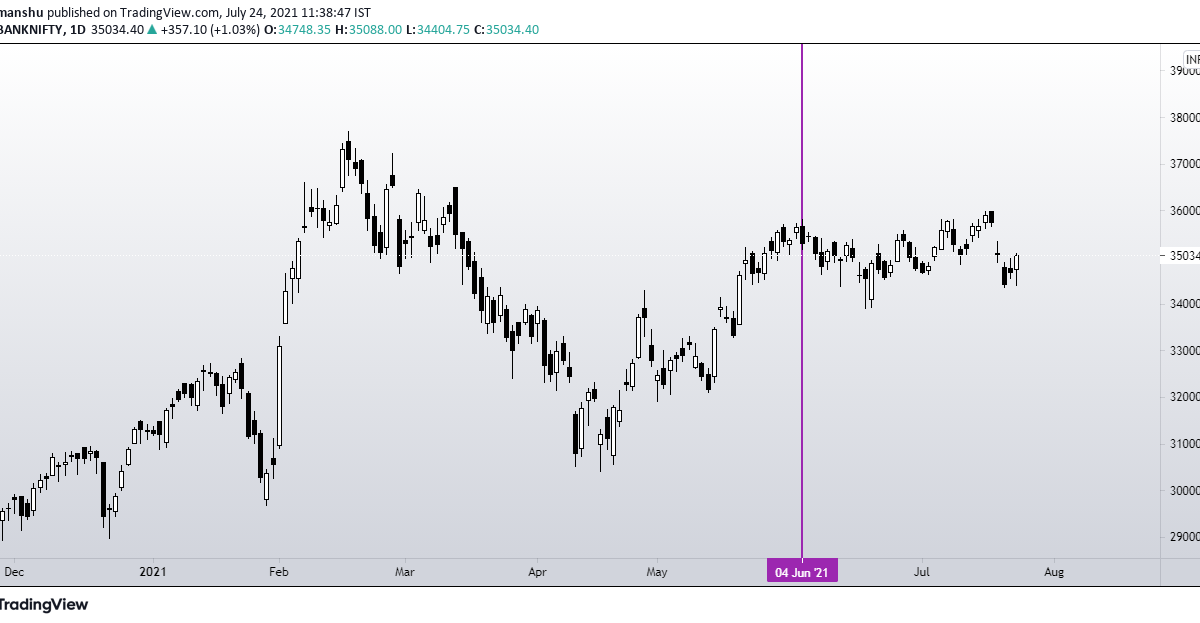
After 4th of June, the trend for Banknifty is not quite clear whether to Buy the Dip or Sell on rise as one day it moves smoothly and the very next day it gets volatile, Kind of non directional within a range considering the previous month’s data.
BANKNIFTY DAILY
This is the daily chart of Banknifty where the 1st Bullish Bat pattern played very nicely on both long as well as short side. Now we’ve another valid Bearish Bat pattern which will stay valid above point B which is [34287] and target for this pattern is the red PRZ zone. [Potential reversal zone].
BANKNIFTY WEEKLY
Banknifty has not only managed to close above B point but also 0.618 retracement [Swing High to Swing Low] which opens the gates for our Target- 36800.
Banknifty OI data shows that there is not much difference between CE and PE writers at 35000 strike at the moment but we’ve 4 trading sessions left and this data keeps on changing.
Open interest
Bearish view-
In a larger timeframe it is just consolidating near a very strong resistance of more than 10 years and we’ve observed that whenever the consolidation happens near ATH the next breakout or breakdown move is quite trendy.
After 4th of June the Trend for Banknifty is not quite clear whether to Buy the Dip or Sell on rise as one day it moves smoothly and the very next day it gets volatile kind of non directional within a range if we look at the previous month data.
BANKNIFTY DAILY
This is the daily chart of Banknifty where the 1st Bullish Bat pattern played very nicely on both long as well as short side now we’ve another valid Bearish Bat pattern which will stay valid above point B which is [34287] and target for this pattern is the red PRZ zone. [Potential reversal zone].
BANKNIFTY WEEKLY
Banknifty not only has managed to close above B point but also 0.618 retracement [Swing High to Swing Low] which opens the gate for our Target- 36800.
Banknifty OI data shows that there is not much difference between CE and PE writers at 35000 strike at the moment but we’ve 4 trading sessions left and this data keeps on changing.
Open interest
Bearish view-
In a larger timeframe it is just consolidating near a very strong resistance of more than 10 years and we’ve observed that whenever the consolidation happens near ATH the next breakout or breakdown move is quite trendy.
BANKNIFTY MONTHLY
Our Target for Banknifty remains the same 42222- https://www.tradetales.in/banknifty-42000/
Disclaimer- This post is written only for educational purposes kindly consult your financial advisor before making any decisions. PEACE.
The Nifty is the flagship benchmark of the National Stock Exchange (NSE), which is a well-diversified index, comprising top 50 companies in terms of free-float market capitalization that are traded on the bourse. It is supposed to reflect the health of the listed universe of Indian companies, and hence the broader economy, in all market conditions. -ET
View- Bullish. Let’s look at the thorough technical analysis of Nifty 50. The current market price of nifty as on 04-07-2021 was 15722 and we are expecting it to reach a target of 30000 in 2-3 years.
NIFTY MONTHLY LOG SCALE
Nifty registered a top on 01-Apr-1992. After that, the prices moved in a channel till 01-Jul-2005 and then comes a massive bull domination phase for almost 4 years. If I consider the data from channel bottom and after that market crashed in 2008 which looks like a channel retest in long term charts and then again the price moved in an upward channel like before.
NIFTY MONTHLY LOG SCALE
In this chart we’ve tried to estimate the time for how the long price stayed inside the first channel and have compared it with the second one and it looks like both the channels took the same amount of time inside the channels. #Stunned So, this gives us a rough idea that for 2-3 years bulls are going to dominate the Nifty but smaller pullbacks and shakeouts cannot be ruled out even if Nifty rallies ferociously.
NIFTY MONTHLY LOG SCALE
After coming out from the first channel it is quite visible how nicely it went up and more than doubled in just a span of 2 and a half year’s. The same might happen in coming years if we are analyzing the price structure correctly. But for this thing to happen global cues also have to support, so let’s look at the chart of NYSE.
NYSE Log scale
NYSE is moving in a very nice upward channel without breaking the lows despite testing it many times. For this chart the analysis is quite simple: As you can see, there’s a midway between highway for bulls and lower lane for bears and whenever the price stayed above the midway, It has rushed madly in the upper lane of bulls. A breakout is yet to happen here and we’ll see it in the coming weeks that how it deals with this stiff resistance and if that happens we’ll have the support from global cues as well.
NYSE Cyclical chart
If we analyze the price structure here, you can see clearly that how beautifully these 2 patterns are constructed and price is behaving the same way like earlier. That’s the reason why Technical Analysts say “History repeats itself”.
DOW JONES INDUSTRIAL AVERAGE WEEKLY
Dow Jones also looks set in weekly timeframe to move much higher as the bigger reverse symmetry is tested and it has also given a Flag breakout. #BULLISH
Disclaimer- This blogpost is shared purely for the educational purposes and we are not liable for anybody’s profit or loss.
This study is totally done only on the basis of Technical Analysis. We know that a lot of factors like Economic conditions, Politics etc. are going to influence if Nifty has to double from here. It depends from person to person that how they want to play this Trend. If you are interested to know the different ways how this Trend can be played for much higher returns and low risk, Don’t wait just shoot up an E-mail at- info@tradetales.in PEACE.