HDFC Life Insurance after breaking out 646 it’s pre Covid-19 High has sustained very nicely above the breakout level and we can see a nice narrow range price squeeze on the technical chart with follow up attempting a minor breakout soon. #Bullish
HDFC LIFE INSURANCE MONHTLY LOG SCALE
On the Weekly timeframe we can see an Inverse Head and Shoulder Pattern Breakout and the price has sustained above the breakout level very nicely if we try to estimate the technical target for this script so it is 950+
Weekly chartSource- STATISTA
For queries related to this post or technical analysis you can mail us here at- Info@tradetales.in
Disclaimer- This post is shared for educational purposes only kindly consult your financial advisor before taking any decisions we’re not liable for anyone’s profit and loss. PEACE.
The NIFTY Smallcap 100 Index is designed to reflect the behavior and performance of the small capitalized segment of the financial market. The NIFTY Smallcap 100 Index comprises of 100 tradable, exchange listed companies.
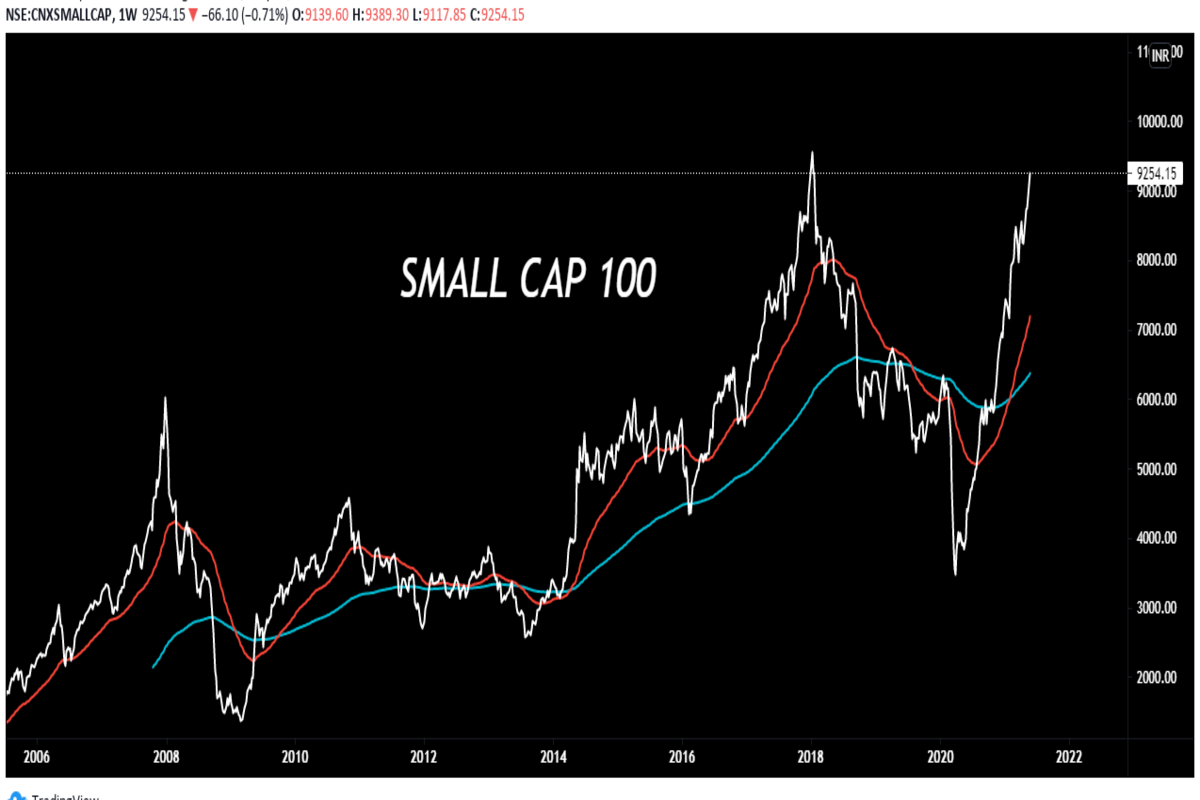
View- Bullish Let’s look at the thorough technical analysis of Nifty SMLCAP 100 grab your cup of coffee.
CNXSMALLCAP100 Weekly time frame indicates that a golden crossover was panned out in the month of January later this year. As you can see when that happened earlier on 24th march 2014 it topped out in 2018 and we witnessed a sharp bull phase upside for 4 years (Round figure). Well, looking at the current scenario this crossover panned out in January and we are now expecting at least 2 to 3 years of bull phase in small cap space.
Also it is very near to it’s top once that happens bulls will have an open arena to crush the bears.
Monthly chart shows that after 1st April,2020 prices did not close below the previous month for even once which shows a very strong trend.
Taking two swings from 2008 top and 2009 bottom previous bull phase ended by completing it’s 1.618 retracement and we saw a long term top.
Now here if we manage to cross the Top Target is going to be 1.618 retracement which is 13644 just like before taking the two swings of 2018 high and 2020 bottom this target is estimated. If this setup plays out well position yourself accordingly and enjoy the next Bull phase which might last several Years.
Disclaimer- The analysis are only for educational purposes. Trade tales is not liable for your Profit or loss. Kindly refer to your financial advisor before taking any decisions. PEACE
A Golden crossover is a Technical way of forecasting the market using moving averages. Some traders and investors often combine it with other indicators and methods so that their risk reward ratio is favorable.
Most of the techniques in technical analysis can be used from 1min time frame to a monthly time frame horizon. There are no specific tools which are only to be used in monthly or weekly timeframe’s. It’s about ‘how you want to use it according to your own trading and investing style?’ Getting straight to the point; Golden crossover happens when, short to medium term 50DMA crosses the long term 200DMA. DMA- Displayed moving average.
Almost all the charting platforms provide this tool for free and you just have to plot these averages and look for 50DMA crossing 200DMA from below. Majorly after a golden crossover in higher timeframe like weekly and monthly we can expect at least 2-3 years of bull market or more depending on other economical factors.
This is one of the best method’s to forecast the market phases and take positions accordingly. The rationale is also very simple: Let’s understand it with the help of example here- When price crosses 50DMA, It simply means that the last 50 day average price is crossed which was earlier acting as a resistance and now we can expect the next phase to be bullish or sideways with bullish bias.
In the same way when 50DMA crosses 200DMA, It means that the last 50 days average price has crossed above 200DMA and price is also above both of these averages. We take it this way that the supply of over 50 and 200 days is now being cleared and a strong rally upside is due.
In the above chart red cord is 50DMA and blue cord is 200DMA and it’s quite clear what happened after the crossover.
We’ve explained this chart completely combining the other methods of estimating the next move because that’s where money is made. Isn’t it? Link- https://www.tradetales.in/nifty-smlcap-100/
Do tell us in the comment box where you saw a golden crossover happening and how you traded it?
Disclaimer- This blog is for educational purposes only. Kindly refer to your financial advisor before taking decisions. PEACE.