HDFC Life Insurance after breaking out 646 it’s pre Covid-19 High has sustained very nicely above the breakout level and we can see a nice narrow range price squeeze on the technical chart with follow up attempting a minor breakout soon. #Bullish
HDFC LIFE INSURANCE MONHTLY LOG SCALE
On the Weekly timeframe we can see an Inverse Head and Shoulder Pattern Breakout and the price has sustained above the breakout level very nicely if we try to estimate the technical target for this script so it is 950+
Weekly chartSource- STATISTA
For queries related to this post or technical analysis you can mail us here at- Info@tradetales.in
Disclaimer- This post is shared for educational purposes only kindly consult your financial advisor before taking any decisions we’re not liable for anyone’s profit and loss. PEACE.
In this blogpost we will be sharing our analysis on top 4 stocks in the alcohol sector sorted market cap wise:-
1. UNITED SPIRITS
As it is quite visible that the stock has already broke out from the descending trendline resistance and bulls are itching to reclaim the ATH once again. September monthly closing is going to play a very important role here and if the stock reclaims it’s ATH once again we might see some selling pressure as it’ll be breaking out after 5 years as the impatient investors who invested around this zone will be selling their stake aggressively. (Just a theory)
UNITED SPIRITS MONTHLY LOG SCALEUNITED SPIRITS MONTHLY LOG SCALE
A parallel channel pattern is also visible on the charts with good base formation in United spirits.
2. UBL
Attached below is the chart of UBL which was trading inside a parallel channel since 8 years and the stock has reclaimed it’s ATH recently. Though, the channel top is quite near which might give an opportunity to add this script on dips.
UBL MONTHLY LOG SCALE
3. GLOBUS SPIRITS
We’ve added Globus spirits in our portfolio when it crossed 422 in June series 2021 and by looking at the price structure it indicates that we are in the 3rd wave and there are no signs of reversal as of now. So one can keep this script on their watchlist as well to add on dips.
GLOBUS SPIRITS MONTHLY LOG SCALE
4. RADICO KHAITAN
In a larger timeframe; the coronavirus hit on this stock looks like a pullback and since then the price is not ready to give up. Another fine script from this space which is getting accumulated in every dip.
RADICO KHAITAN MONTHLY LOG SCALE
Radico khaitan is forming a very nice flag/rectangle pattern (Accumulation) right at the top and by the price volume action, it looks like selling is getting absorbed and we can see a decent move on the upside sooner or later (Just an estimate).
For queries related to this post or technical analysis you can mail us here at- Info@tradetales.in
Disclaimer- This post is shared for educational purposes only kindly consult your financial advisor before taking any decisions we’re not liable for anyone’s profit and loss. PEACE.
After facing some heat from the larger Timeframe Trendline resistance Banknifty consolidated for almost 5-6 months if we look at a larger timeframe but in AUGUST it has closed nicely above 35600 which was acting as a resistance.
BANKNIFTY MONTHLY LOG SCALE
As of now chart of Banknifty indicates good accumulation just below the trendline resistance and if it takes out this resistance we can expect Banknifty to reach our previous target which is 42000. Link- https://www.tradetales.in/banknifty-42000/
BANKNIFTY DAILY
A daily close above 36870 and we are heading towards 42222. #HarmonicBat
For queries you can mail us here at- Info@tradetales.in
Disclaimer- This post is for educational purposes only kindly consult your financial advisor before taking any decisions we’re not liable for anyone’s profit and loss. PEACE.
The Nifty is the flagship benchmark of the National Stock Exchange (NSE), which is a well-diversified index, comprising top 50 companies in terms of free-float market capitalization that are traded on the bourse. It is supposed to reflect the health of the listed universe of Indian companies, and hence the broader economy, in all market conditions. -ET
View- Bullish. Let’s look at the thorough technical analysis of Nifty 50. The current market price of nifty as on 04-07-2021 was 15722 and we are expecting it to reach a target of 30000 in 2-3 years.
NIFTY MONTHLY LOG SCALE
Nifty registered a top on 01-Apr-1992. After that, the prices moved in a channel till 01-Jul-2005 and then comes a massive bull domination phase for almost 4 years. If I consider the data from channel bottom and after that market crashed in 2008 which looks like a channel retest in long term charts and then again the price moved in an upward channel like before.
NIFTY MONTHLY LOG SCALE
In this chart we’ve tried to estimate the time for how the long price stayed inside the first channel and have compared it with the second one and it looks like both the channels took the same amount of time inside the channels. #Stunned So, this gives us a rough idea that for 2-3 years bulls are going to dominate the Nifty but smaller pullbacks and shakeouts cannot be ruled out even if Nifty rallies ferociously.
NIFTY MONTHLY LOG SCALE
After coming out from the first channel it is quite visible how nicely it went up and more than doubled in just a span of 2 and a half year’s. The same might happen in coming years if we are analyzing the price structure correctly. But for this thing to happen global cues also have to support, so let’s look at the chart of NYSE.
NYSE Log scale
NYSE is moving in a very nice upward channel without breaking the lows despite testing it many times. For this chart the analysis is quite simple: As you can see, there’s a midway between highway for bulls and lower lane for bears and whenever the price stayed above the midway, It has rushed madly in the upper lane of bulls. A breakout is yet to happen here and we’ll see it in the coming weeks that how it deals with this stiff resistance and if that happens we’ll have the support from global cues as well.
NYSE Cyclical chart
If we analyze the price structure here, you can see clearly that how beautifully these 2 patterns are constructed and price is behaving the same way like earlier. That’s the reason why Technical Analysts say “History repeats itself”.
DOW JONES INDUSTRIAL AVERAGE WEEKLY
Dow Jones also looks set in weekly timeframe to move much higher as the bigger reverse symmetry is tested and it has also given a Flag breakout. #BULLISH
Disclaimer- This blogpost is shared purely for the educational purposes and we are not liable for anybody’s profit or loss.
This study is totally done only on the basis of Technical Analysis. We know that a lot of factors like Economic conditions, Politics etc. are going to influence if Nifty has to double from here. It depends from person to person that how they want to play this Trend. If you are interested to know the different ways how this Trend can be played for much higher returns and low risk, Don’t wait just shoot up an E-mail at- info@tradetales.in PEACE.
After underperforming, Nifty for quite a while now; Banknifty has given a breakout on Friday after the monthly expiry of June series. Now in coming months what can we expect from Banknifty?
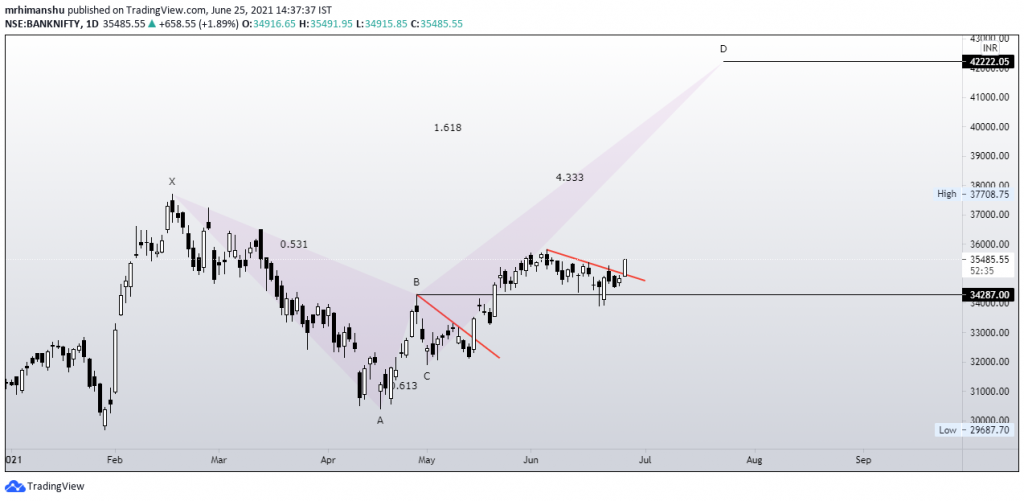
Pattern name- Crab Harmonic pattern
This is the daily chart of Banknifty where we can see that after breaking out from the B point of Crab pattern, it smoothly retested and started moving up and also slashed the Descending trendline. Further, we can expect Banknifty to reach the Target of point D of this pattern which is at 42222 and if that happens we can see Banknifty outperforming Nifty for coming months. Pattern invalidation – DAILY close below point C (32055).
June series top and bottom analysis
June series price action was very volatile in Banknifty but June series top and bottom was well estimated by us as shown in the above chart and now we’re completely bullish on Banknifty and expecting HH and HL with good momentum.
BANKBEES
Bank bees look very attractive here at this point for medium term investing for a target of 417- 420.
For queries you can mail us here at- Info@tradetales.in
Disclaimer- This post is for educational purposes only kindly consult your financial advisor before taking any decisions we’re not liable for anyone’s profit and loss. PEACE.